November 29, 2012

By Lee Belbin
I like good wine. Fortunately these days, Australia has a huge number of excellent value wines. After many years enjoying Australia’s wonderful Shiraz, I’ve transitioned through Cabernets to Pinot Noir. However, finding good Pinot Noir is a lot harder than finding good Shiraz.
So that brings me to the point of this article. Maybe you want to discover wineries that are likely to produce a good wine? Maybe you want to grow your own? If the latter, note what a wine grower friend of mine once said: Wine is 33% grapes, 33% winemaking and 33% marketing. The remaining 1% is probably luck.
Can the Atlas of Living Australia be used to find locations of environmental conditions suitable for a specific species? As you have probably guessed, the answer is “Yes!” We can’t help you with winemaking or marketing, but we can (among many other things) help identify areas that could/should produce wine (or anything) that you may like.
The Basics
The Atlas of Living Australia has two basic types of information about Australia’s living things: Species and Environments. As of November 2012, we have over 35 million occurence records about the location of species. People over centuries have recorded what species they observed or collected, and the Atlas has worked hard over the past five years to try and get as much of this data together online in one place. This task continues.
We have a lot of information about species, but one of the most important is “Where do they occur?” The Atlas has also integrated nearly 400 environmental layers. These layers have been collected and integrated into our Spatial Portal because we believe that they are likely to have some relationship with species. We know that the location of species is controlled at least in part by some of the environmental characteristics of these layers.
For example, we know that trees will not grow above the ‘tree line’: the altitude where it gets too cold for them to grow let alone reproduce. We also know that plants and animals require water: not too much and not too little. So each species occurs in an envelope of environmental characteristics.Each environmental layer is a map linking location and environment.
If we know the location, we can identify its environment. The opposite is also possible with the Atlas: If we know the environment, we can find the location/s where this environment occurs.
That’s the key to this exercise: If we know WHERE (good) Pinot Noir (or anything else!) is produced, then we can find out what environment it prefers, and the locations of these environments.
Find the Target Areas
The first step in this study is to locate one or more wineries that you think do it best. In this case, I have selected a few locations in the Yarra Valley because it is the area that produces my favourite style of Pinot Noir.
I’ve also used random coordinates within the area to avoid identifying any particular wineries, but these locations are typical of good Pinot territory. The easiest way to find the location of the wineries is to use either the Spatial Portal or Google Maps. Use the web to find the address and then find the latitude and longitude (in decimal degrees). Repeat for each winery that produces what you like.The next step is to enter those coordinates into Excel or the equivalent and save the file as a type CSV (comma separated variables).
The first column should contain the name of the first winery. The second column contains the longitude in decimal degrees while the third column is the latitude of that winery in decimal degrees. You can add as many wineries as you like, but remember that they should all have one thing in common – that they grow the best of their type as far as you are concerned.
Below is an example of what the contents of that file may look like.
ID | Longitude | Latitude |
| Winery 1 | 145.64 | -37.80 |
| Winery 2 | 145.56 | -37.79 |
| Winery 3 | 145.59 | -37.77 |
Import the Target Locations and Export the Environmental Data (in one step)
The next step is to import the CSV file into the Spatial Portal of the Atlas of Living Australia and find out what the environment is at these locations. Select Export | Point sample. This will initiate a dialogue to import our points and then append their environments.
The Spatial Portal’s point sampling option
The first question in the process is “What area?” Use “Current extent” which should be Australia by default. The next step is usually to select one or more species and to have the locations of those species used as the sample. For this exercise however, we will use the locations of our wineries as a substitute for species locations. In the Spatial Portal, you can import the location and a bunch of associated features of any type of point observation, species or otherwise. For example, in the Case Study on Wind Farms, we imported the location of the wind farms as if they were species locations (which in a sense they are). Select the option Import points, and then at the next step, enter the name of the points, let’s call it Wineries. The description is optional.
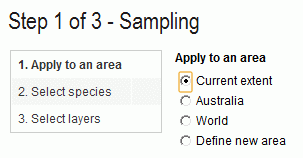
Sampling option 1: Use current extents (Australia)
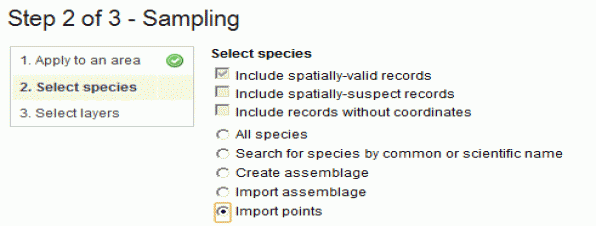
Sampling option 2: Import our tartget points
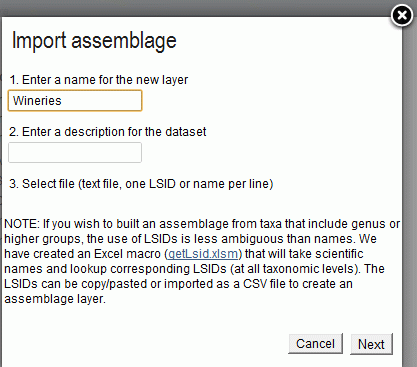
Sampling option 3: Name our tartget point dataset
We could have used another Spatial Portal Option to separately import the points and plot them (Import | Points), and then export the points with the environmental data attached (Export | Point sample – as we are doing now). We will cut corners by doing the import and export in one go.
Select the Environmental Factors
We next come to the hard part – figuring out which of of the hundreds of environmental layers in the Atlas would be relevant to defining the environment that characterizes the best growing area for Pinot Noir grapes.
One surprising outcome of research examining the hundreds of environmental layers is that a small number of relatively independent layers seem capable of defining Australian environments. One reason for that is that most of the environmental layers are related: One layer can usually substitute for many similar layers. While that is a topic for another Case Study, suffice to say that it appears that five well-chosen environmental layers seem to be able to define the environment of most areas of Australia (see Williams et al. 2012). Note: We know less about the marine environment and consequently have fewer marine than terrestrial layers.
For simplicity, we will use a predefined suite of five relatively independent layers that appear to cover Australian land environments: Use “Best 5 Williams 1960 centered climate layers.” Ideally, the species of interest should be researched to identify the environmental factors that it prefers. As well as temperature and rainfall, we would expect soil conditions, slope and aspect to be significant when it comes to grapes (terroir).
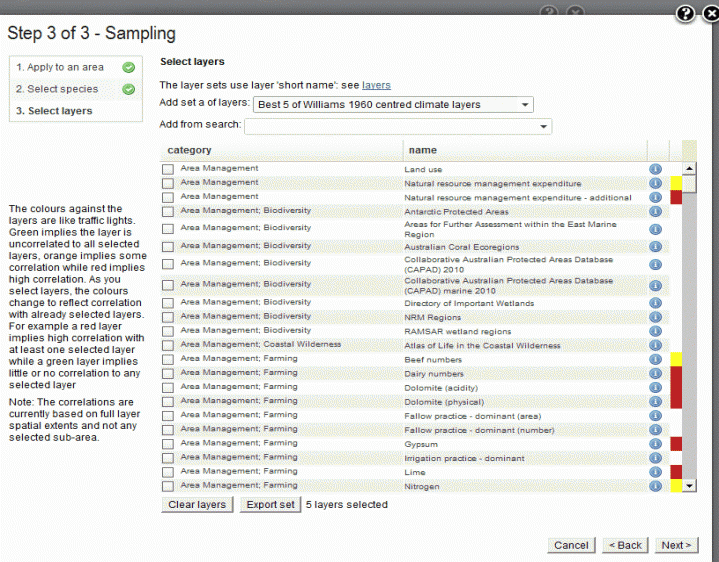
Selecting our environmental layers: Use "Best 5 Williams 1960..."
When the process is complete, we will have a file called Wineries.csv. When we examine the exported file, we can see that the Spatial Portal has appended values of the five layers to the right-hand side of the table.
ID | Longitude | Latitude | Evaporation – month min | Precipitation – driest month | Precipitation – equinox seasonality ratio | Precipitation – spring or autumn season | Water stress index – month max |
| Winery 1 | 145.64 | -37.80 | 32.01 | 67.00 | 1.30 | 0.30 | 81 |
| Winery 2 | 145.56 | -37.79 | 31.83 | 66.00 | 1.26 | 0.26 | 81 |
| Winery 3 | 145.59 | -37.77 | 31.77 | 66.40 | 1.28 | 0.28 | 81 |
There is very little difference in environmental values of the five layers between the three different (fictitious) winery sites. This is not surprising as I selected three random locations in the Yarra Valley of Victoria and therefore one would not expect much environmental difference based on these characteristics.
Generate the Envelope
The next step uses these values in the Spatial Portal to find out where geographically these environmental conditions may also occur in Australia. We will use a feature of the Spatial Portal for defining areas called an Environmental Envelope, as noted above. This envelope defines the environment of our preferred Pinot Noir wine based on my sample points in this case.
We need to define the upper and lower limits of the environmental values. For this study, let’s use the following values
- Evaporation – month min (31-33)
- Precipitation – driest month (66-68)
- Precipitation – equinox seasonality ratio (1.2-1.4)
- Precipitation – spring or autumn season (for this exercise, let’s skip it)
- Water stress index – monthly max (all the same so let’s skip this environmental factor as well)
These values provide a slightly broader envelope to allow for measurement errors and environmental variation. In the Spatial Portal, go to Add to Map | Areas and then select Define environmental envelope. Enter Evaporation – month min in the search box and then enter the lower and upper bound values for this layer (31.5 and 32.5) and then press the button Update species count. The map will be redrawn to display those environments and you will get a species count, in my case of 14,870. What the Spatial Portal is saying is that there are 14,870 species within those environmental ranges in Australia.
Add the remaining two layers, each time entering the ranges and pressing Update species count. When done, we have 994 species. Note this this number will be dynamic, reflecting additions to the Atlas over time. Changing the envelope by even small values will usually result in quite different counts of the number of species.
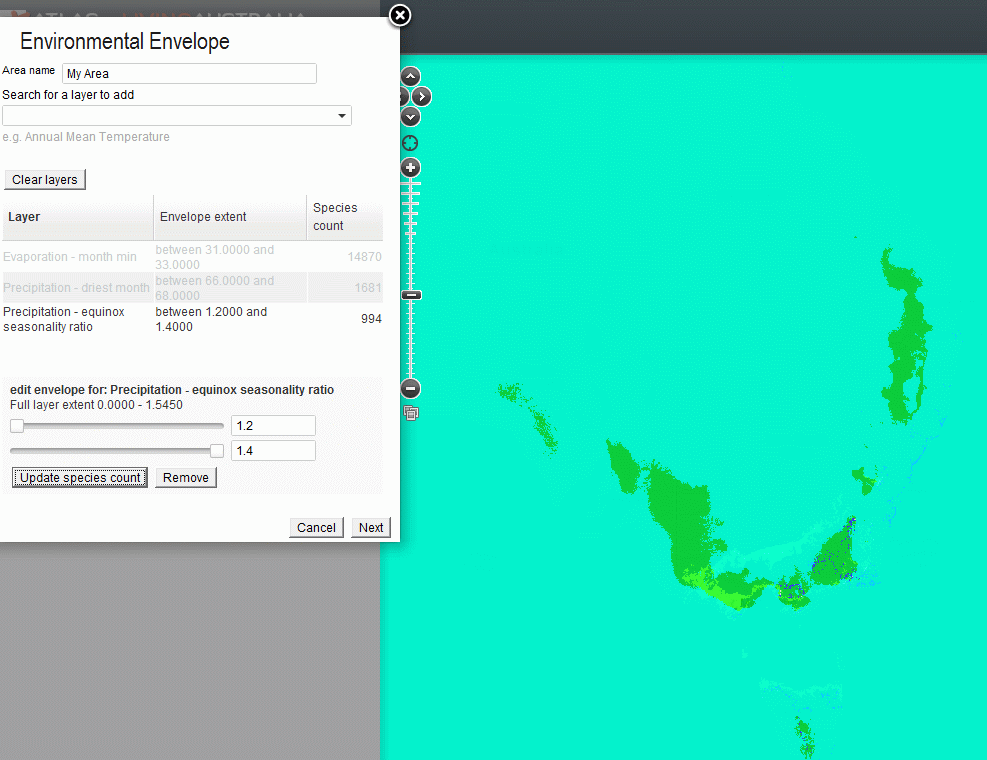
Environmental envelope parameters
When the count has been updated, we have the definition of the environmental envelope. Press Next and the area that encompasses those environmental conditions will be mapped. To see the areas more clearly, increase the opacity of the area layer (top left on the window, slide the slider bar far right) and then select the Map options layer and select Minimal to use the Open Street Maps base map.This base map is simpler and will better display the target areas.
It is not surprising that you can see a number of areas in the Yarra Valley identified. You will however also see a number of areas near Nurran in eastern Victoria that look promising and an even smaller set of areas near Rawson mid-way between the Yarra Velly and Nurran. That’s interesting.
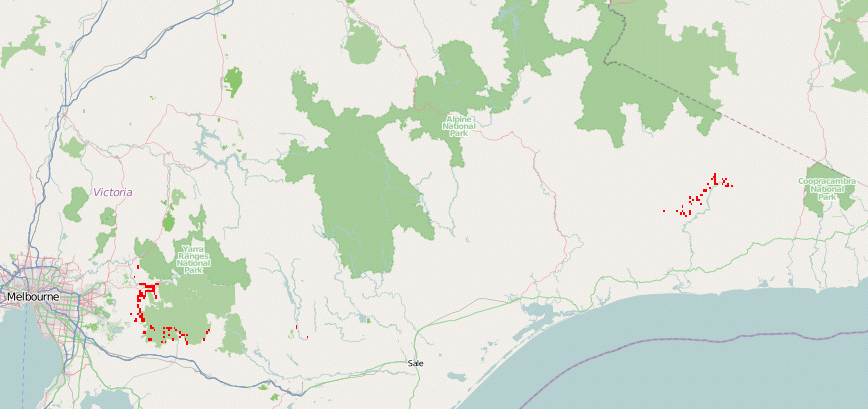
The geographic expression of the environmental envelope
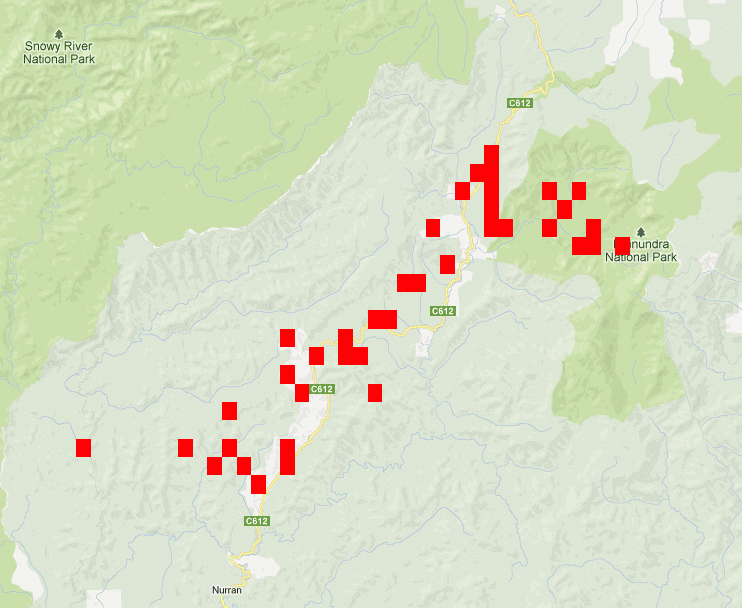
The environmental envelope near Nurran Victoria
Summary
If you can identify the locations where your target species like to be, it is then easy to use the Spatial Portal of the Atlas of Living Australia to identify all areas within the Australian region where those environmental conditions occur. You may get some surprises.
Reference
Kristen J. Williams, Lee Belbin, Michael P. Austin, Janet L. Stein & Simon Ferrier (2012): Which environmental variables should I use in my biodiversity model? International Journal of Geographical Information Science, DOI:10.1080/13658816.2012.698015
About the Author
Lee Belbin led the team in the development of the Atlas Spatial Portal, and is now Scientific Advisor to the Atlas of Living Australia. Lee started working life as an exploration geologist in Australia and Canada in 1970. In 1972, he spent 6 years in research and teaching analytical geology at the Australian National University. From 1979 to 1995 Lee’s research moved to quantitative ecology at CSIRO, with the last three years focused on project management. From 1995 to 2005, he established and managed one of the world’s first multidisciplinary science data centres at the Australian Antarctic Division. During this time he developed national and international policies and methods for information management and state of the environment reporting. For the past 6 years, his company (Blatant Fabrications Pty Ltd) has focused on managing national and internal projects related to sharing scientific information. Lee has published more than 100 papers on geology, ecology, information management and policy.