Author: Lee Belbin
Tabulation in the Spatial Portal of the Atlas of Living Australia is a powerful way of comparing how species and areas are partitioned. Think of tabulations as the categorical (class) equivalent to scatterplots. Scatterplots display species occurrences against two environmental variables represented as X and Y-axes, for example ‘Mean annual temperature’ or ‘Annual rainfall’.
Tabulations replace these X and Y axes of continuous numeric values with categories or classes. For example, the X-axis could be Australian States and Territories (NSW, QLD, VIC …) while the Y-axis could be the various types of Australian reserves (CAPAD: Collaborative Australian Protected Area Database – see http://www.environment.gov.au/topics/land/nrs/science-maps-and-data/capad).
The Spatial Portal of the Atlas currently has the following contextual/class layers available for cross-tabulation (see http://spatial.ala.org.au/layers). The values for the tables are updated weekly from all available occurrence records in the Atlas of Living Australia.
- Areas for Further Assessment within the East Marine Region
- Australian Coral Ecoregions
- Australian States and Territories
- Collaborative Australian Protected Areas Database (CAPAD) 2010
- Collaborative Australian Protected Areas Database (CAPAD) marine 2010
- Commonwealth Electoral Boundaries
- Directory of Important Wetlands
- Drainage Divisions Level 1
- Drainage Divisions Level 2
- Fallow practice – dominant (area)
- Fallow practice – dominant (number)
- Freshwater Ecoregions of the World
- Geomorphology of the Australian Margin and adjacent seafloor
- IBRA 6 Regions
- IBRA 6 Sub Regions
- IBRA 7 Regions
- IBRA 7 Subregions
- IMCRA Meso-scale Bioregions
- IMCRA Regions
- Irrigation practice – dominant
- Koppen Climate Classification*
- Koppen Climate Classification – sub areas*
- Land cover
- Land Cover Type – IGBP (2011)*
- Land use
- Local Government Areas
- Marine Ecoregions of the World
- National Dynamic Land Cover
- NRM Regions
- RAMSAR wetland regions
- River Regions
- Statistical Local Areas
- Stubble practice – dominant (area)
- Stubble practice – dominant (number)
- Surface Geology of Australia*
- Terrestrial Ecoregional Boundaries
- Tillage practice – dominant (area)
- Tillage practice – dominant (number)
- Vegetation – condition
- Vegetation types – native
- Vegetation types – present
The Tabulation tool in the Spatial Portal (Tools | Tabulate) will request the first layer and then show only complementary layers that are available for the second axis. For example, if a marine layer such as IMCRA is chosen, then only marine layers will be offered as a second choice. The Spatial Portal then provides the option to produce one of the following 12 tables for the selected pair of layers:
- Area of intersection (km2)
- Percentage of total area
- Percentage of area row total
- Percentage of area column total
- Number of species/taxa
- Percentage of all species/taxa
- Percentage of species/taxa row total
- Percentage of species/taxa column total
- Number of occurrences of selected taxa
- Percentage of occurrences of selected taxa
- Percentage of taxa row total
- Percentage of taxa column total
For the above example (States/Territories vs. CAPAD 2010), tabulation #5 from the list above would produce Table 1. The colour codes used in this case study are used to provide a quick indication of high and low values in the cells of the table.
Table 1 shows that Queensland “National Parks” have 24,035 different species while the ACT has 1,244 species in the reserve class called “Wilderness Zone”. The same tabulation shows that “Indigenous Protected Areas” contain 13,940 species.

Table 1: Number of species by reserve type in States and Territories
The zero species in “Natural Features Reserve” in South Australia implies that the Atlas has no occurrence records for any species for this class of reserve in South Australia. This is an interesting fact in itself: A reserve with no indication in the Atlas as to why it is a reserve.
These zeroes highlight one of the many gaps in the Atlas data that would be nice to fill. Another significant gap at this time is the absence of data from the Victorian Department of Environment and Primary Industries and the Queensland Department of Environment and Heritage Protection. This gap will bias national perspectives derived from these tables. The degree of bias is unknown, but judging from the distribution of data across States and Territories (see http://dashboard.ala.org.au), the bias may not be as bad as anticipated. The Atlas still represents the most comprehensive, publicly available databases of Australia’s flora and fauna with over 41 million records and 143,000 species, but that is probably a fraction of what is out there. So, anything you can do to help fill the gaps would be appreciated by current and future Australians.
The blank cells in the table represent combinations that do not exist. For example, there are no “Wilderness Parks” in the ACT or “Forest Reserves” in the Northern Territory.
The total number of species in the bottom-right of the table (293,144) is across all types of reserves and States/Territories with the following caveat:
Due to the method of calculation, the row and column totals are referred to as ‘non-unique’ species. In other words the marginal totals have been calculated as the sum of the respective rows or columns. No consideration has therefore been made for the same species occurring in more than one class. We will address this issue as resources permit.
Table 1 can also be used to see how species are distributed across the different reserve types and the different States and Territories. For example, when it comes to “National Parks”, Queensland is top with 24,035 species followed by NSW, then WA with the ACT bringing up the rear. The ACT is small in area compared with the other States and Territories so this may not be a fair comparison. Other table options may provide ways to address such issues.
For example, Table 2 is the corresponding table for area, displayed as percentages of the total area of all reserve types across all States and Territories. For example, “Conservation Parks” in South Australia account for 6.1% of the total area of all reserve types in Australia. Likewise, Table 2 shows that “Indigenous Protected Areas” in Australia account for 24.2% of the area of all reserve types, and that Western Australia has the highest State/Territory total area across all reserve types: 31.1%.

Table 2: Percentage of reserves by area by State and Territory
To take the total area of each State and Territory into account, simply add the total areas in square kilometres to Table 1 in the table list (area in square kilometres) and then calculate the percentages by State/Territory. This is what I have done to produce Table 3 (below). This shows a different set of outcomes.
I had wrongly assumed that Tasmania would have been the State or Territory with the highest proportion of area set aside with reserves. The ACT has however been the most impressive in setting aside 68% of its total area as reserves; 39% as “National Parks”, 13% as “Nature Reserves”, 14% as “Wilderness Zones” and 2% as “Commonwealth National Parks”. Tasmania (53% of total area) doesn’t do badly with 28% of its total area (including islands) as “National Parks”, 10% as “Conservation Areas” and 5% as “Regional Reserves”.
Table 3 shows that when the area of the State or Territory is taken into account, Queensland now brings up the rear (by a margin of 3% over New South Wales) with a total reservation area of 7% of the State. Come on Queensland! These reserve areas will be increasingly important in the future to help mitigate species loss with climate change predictions (see Dawson et al. 2011; Booth 2012). Another surprise to me was the indigenous reserve areas. I expected that the Northern Territory would have had more than 6% of the Territory as indigenous-related reserves, but even so, these areas do account for more than 50% of the areas of all reserve types in the Territory.
The other thing that is notable is the CAPAD 2010 classification itself (http://www.environment.gov.au/topics/land/nrs/science/capad/2010). There are 59 reserve types across all States and Territories. This is one of many examples where Australia’s States and Territories tend to do their own thing. For example, New South Wales has eight reserve types only found in that State:
- CCA Zone 1 National Park
- CCA Zone 2 Aboriginal Area
- CCA Zone 3 State Conservation Area
- Flora Reserve
- Karst Conservation Reserve
- Permanent Park Preserve
- Regional Park
- State Conservation Area
Is there a substantial difference between a “CCA Zone 1 National Park” and a “National Park”? In some cases, the categories are required. The Northern Territories “Hunting Reserve” obviously should not be included in “National Park” or “Conservation Reserve”. A national system of reserves types would seem to me to be a wise advance?
The same could be said of conservation status and invasive status in Australia. The IUCN Red List categories (http://www.iucnredlist.org/) at least provide an international standard that is universally valued. Sadly, the same cannot be said about ‘invasive status’. Not only do Australian States and Territories have a variety of invasiveness classes, there is no international equivalent to the IUCN Red list – call it the Black List. Hopefully projects such as http://www.issg.org/ will help to address this significant gap.

Table 3: Percentage of State/Territory area by all reserve types
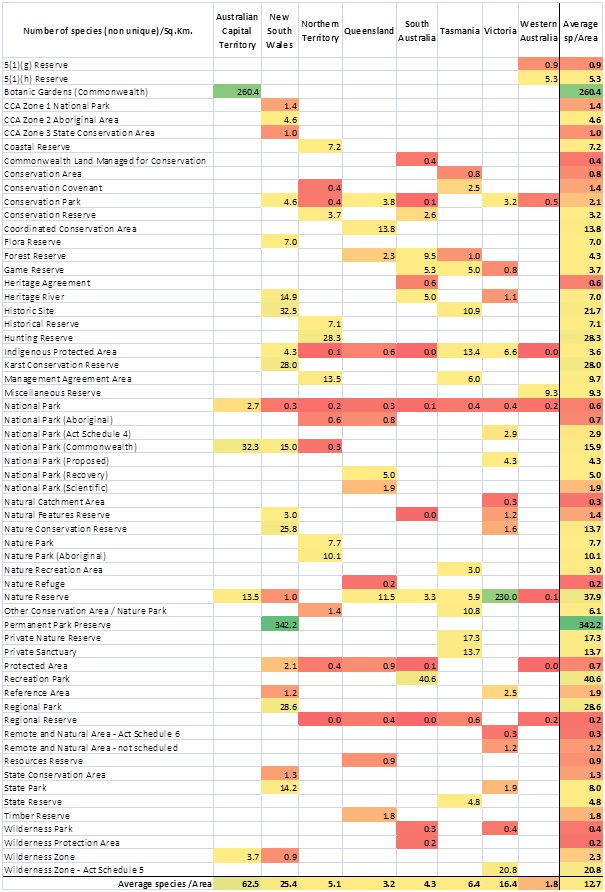
As an alternative to Table 3, you could also calculate the number of species per square kilometre. This would provide a means of evaluating species richness density across reserve types and States/Territories – see Table 4 below.
This table is colour coded from red as low values, through yellow, to green as high values. The highest value of 342.2 species per square kilometre occurs in “Permanent Park Preserve” in New South Wales. The high value is due to there being 2,532 species in 7 square kilometres. The 230 value for “Nature Reserves” in Victoria is similar in having a high species count in a small area. These high species richness values are associated with small and well surveyed reserves where the data is in the Atlas. High species richness per area is also evident in the Australian National Botanic Gardens in Canberra. No surprises there, but it is a pity that this botanic garden seems to be the only one of its category in Australia.
Another notable aspect of Table 4 is the low richness values for the “National Parks”, except for “Commonwealth National Parks” in the ACT and NSW. This aligns with observations of Braithwaite et al. (1993) who suggested that most of the ‘species rich’ areas in temperate Australia were cleared early by European settlers for agriculture and that the current reserve system represents areas that farmers weren’t interested in. The tabulation tool in the Atlas is a way of examining this hypothesis. However, as noted elsewhere, the current data in the Atlas are generally not the result of systematic surveys so qualifications would have to be made. It is hoped that systematic survey data from sister projects such as TERN will find their way into the Atlas in the near future.
Looking at the marginal values of Table 4, you can see that the ACT is the State/Territory with the highest average number of species/sq.km across its reserves: 62.5 species/sq.km; New South Wales is a distant second with 25.4 species/sq.km while Western Australia brings up the rear at 1.8 species/sq.km. Looking at the average richness density across all the reserve types, the stand-outs are the small reserve types noted above. The other high values are “Recreation Parks” in South Australia (40.6 species/sq.km), “Nature Reserves” (37.9 species/sq.km), “Regional Parks” in New South Wales (28.6 species/sq.km), oddly, “Hunting Reserves” in the Northern Territory (28.3 species/sq.km) and not surprising – “Karst (limestone) Conservation Reserves” in New South Wales (28.0 species/sq.km). The lowest richness density values are to be found in “Nature Refuges” in Queensland, “Regional Reserves” and “Wilderness Protection Areas”, all ~0.2 species/sq.km. Obviously more data would be useful to address these gaps.

Table 4: Species richness per unit area for States and Territories across reserve types
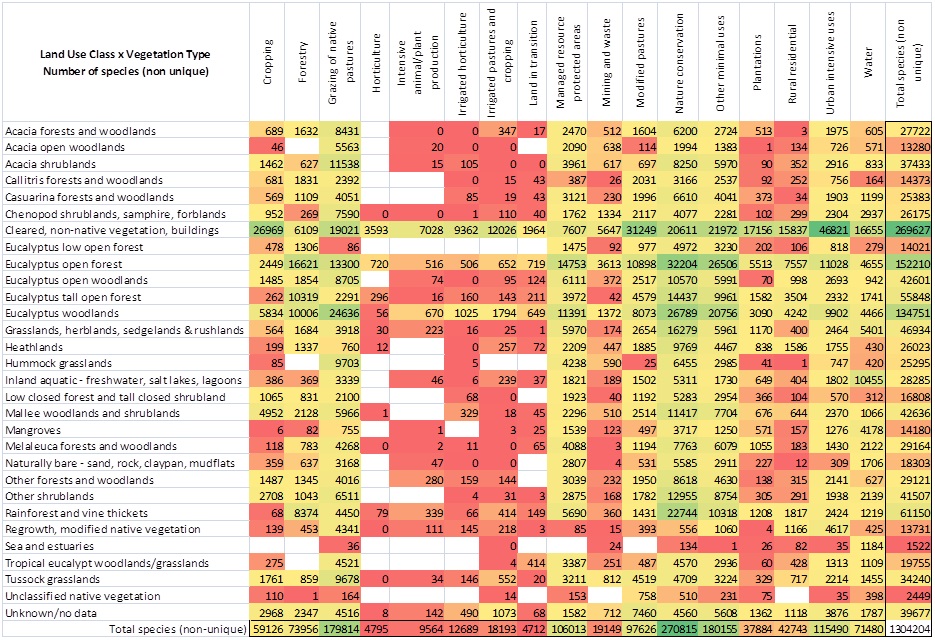
Tables 5 and 6 are based on the contextual layers “Land Use Class” and “Vegetation Type”. These tables demonstrate another significant aspect of the tabulations in the Atlas: The reserve types (CAPAD 2010) in Tables 1-4 don’t cover all the land in Australia even though ‘Australian States and Territories’ do. In other words, the overall area addressed by Tables 1-4 are only the reserves. This isn’t the case with Table 5 and 6 as “Land Use Class” and “Vegetation Type” both cover all of the land in Australia.
Table 5 totals the number of species in each class combination. For example, there are 347 species within “Acacia forests and woodlands” in “Integrated pastures and cropping” and 26,023 (non-unique) species within “Heathlands”. It is interesting to note that “Cleared, non-native vegetation, buildings” produces the top count of nearly 270,000 species. This high species count may include a high proportion of ‘exotics’ – which could be tested using Tools | Area report in the Spatial Portal (http://spatial.ala.org.au). The tables raises many questions that would be interesting to pursue.

Table 5: Species richness per unit area across State and Territories and reserve types
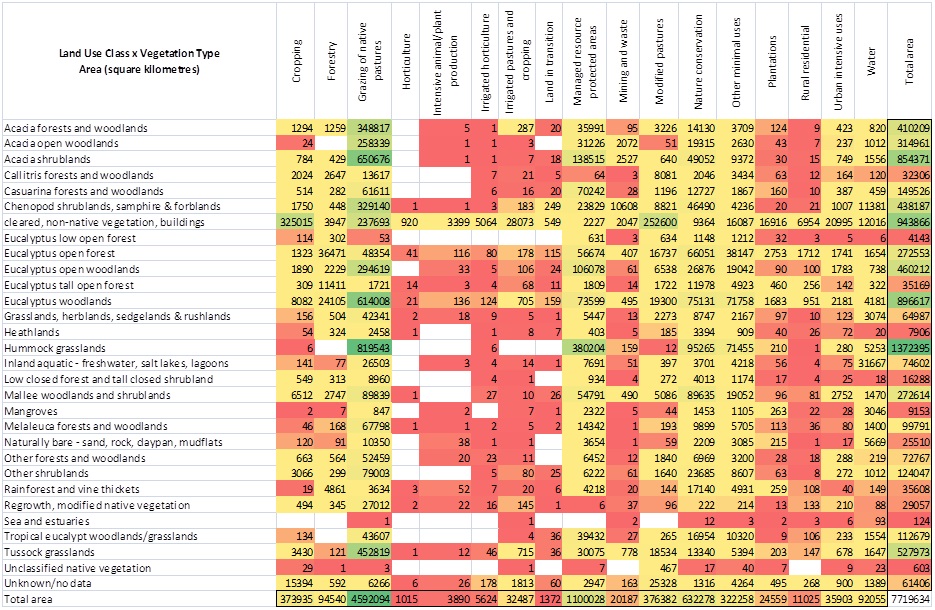
Table 6 displays the area in square kilometres of the same class combinations as Table 5. For example, “Acacia forests and woodlands” in “Integrated pastures and cropping” has an area of 287 sq.km and “Heathlands” occupy a total of 7,906 sq.km. Here we note that the “Cleared, non-native vegetation, buildings” covers 943,886 square kilometres so it isn’t a trivial area for its high species richness. Interesting?
Table 6 also highlights another interesting issue: A comparison of mining and agriculture. Mining often gets a bad name by comparison with agriculture when it comes to conservation of Australia’s flora and fauna. Admittedly, we cannot eat metals or coal so we are dependent on agriculture for our food and much else. Then again, try living without metals. The land use class “Mining and waste” covers 20,187 sq.km while the combined classes of “Cropping”, “Grazing of native pastures”, “Intensive animal/plant production”, “Modified pasture” and “Irrigated lands” total 5,384,413 sq.km. That is 266 times the area used by mining operations.
All things being equal (and they rarely are), it is therefore likely that agriculture affects biodiversity more than mining does. Looking at Table 5, the “Mining and waste” land use has 19,149 species associated while the combined agricultural classes have 377, 012 species. Note again that these are ‘non-unique’ species – species occurring in more than one class are counted as multiple species. None the less, you can see that agriculture potentially impacts roughly 200 times the number of species that mining does. In both land uses, there will be areas that are well-managed for conservation and those that aren’t. It won’t make much difference however to most species if they were to be found in an area that is now a 200m hole in ground or the middle of a wheat field. In both cases, they will likely not be there. Food for thought?

Table 6: Area (square kilometres) of combined land use classes and vegetation types
As I hope you are beginning to see, these tabulations raise a large number of interesting questions that could be addressed at least in part by data and tools in the Atlas. The tool has also exposed a number of gaps – a useful thing indeed.
Have fun: There are 6,324 (12*34*(34-1)/2) terrestrial and 180 (12*6*(6-1)/2) marine tables available. Admittedly, not all combinations may be useful.
About the Author
Lee Belbin led the team in the development of the Atlas Spatial Portal, and is now a scientific advisor to the Atlas of Living Australia. Lee started working life as an exploration geologist in Australia and Canada in 1970. In 1972, he spent 6 years in research and teaching analytical geology at the Australian National University. From 1979 to 1995 Lee’s research moved to quantitative ecology at CSIRO, with the last three years focused on project management. From 1995 to 2005, he established and managed one of the world’s first multidisciplinary science data centres at the Australian Antarctic Division. During this time he developed national and international policies and methods for information management and state of the environment reporting. For the past 10 years, his company (Blatant Fabrications Pty Ltd) has focused on managing national and internal projects related to sharing scientific information. Lee has published more than 150 papers on geology, ecology, information management and policy.
References
Areas of Australian States and Territories: http://www.ga.gov.au/education/geoscience-basics/dimensions/area-of-australia-states-and-territories.html
Booth, T.H. (2012). Biodiversity and Climate Change Adaptation in Australia. Advances in Climate Change Research 3, 12-21. DOI: 10.3724/SP.J.1248.2012.00012.
Braithwaite, L.W. Belbin, L., Ive, J.R. & Austin, M.P. (1993). Land use allocation and biological conservation in the Batemans Bay forests of New South Wales. Australian Forestry, 56, 4-21.
Collaborative Australian Protected Area Database (CAPAD 2010): http://www.environment.gov.au/topics/land/nrs/science/capad/2010
Dawson, T.P., Jackson, S.T., House, J.I., Prentice, I.C. and Mace, G.M. (2011). Beyond Predictions: Biodiversity Conservation in a Changing Climate. Science 332, 53-58. DOI: 10.1126/science.1200303.