This tool samples environmental and contextual data layers at locations defined by species, genus, family etc. occurrences in a defined area.
Think of this tool as driving a needle through through the occurrence locations and reading off all the values of a user-selected environmental and contextual layers. In other words, the occurrences define the geographic locations where the layers are sampled.
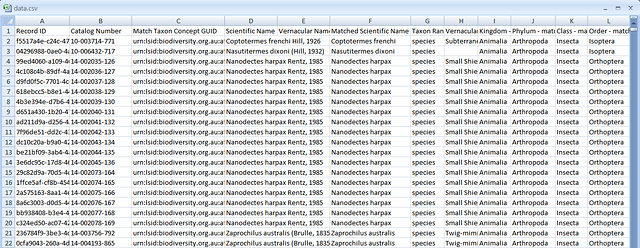
The data produced from Sampling contains records of all the species occurrence details (mainly in Darwin Core fields), data quality checks and with chosen environmental and contextual values appended to the record.
To use the function:
1. Select the Export menu and then Points.

2. Select an area to analyse
Note the ‘Define new area’ will involve an extra step (please refer to Add Area for additional information).
If you have a one or more predefined areas already mapped, then these will be available as an option to restrict the sample to any one of these active area layers, e.g., ‘My Area’, or in this case the named area Queanbeyan.

3. Select species, point locations or LSIDs
Select one of the following methods to determine the points for sampling:
- Lifeform - select a high level category of organism
- All species.
- Search for species by common or scientific name (can be a higher taxonomic level, such as genus, family or order).
- Search for multiple species by scientific or common name.
- Use species list - this allows you to use a pre-existing species list from the ALA lists tool
- Create new species list - this allows you to upload or paste in a .csv file of taxa names
- Upload points. If you have used the sandbox to upload points, these datasets are available for selection using this option.
- Import points - this allows you to upload or paste in a .csv file of occurrence points
The Upload points and Import points have an additional step to upload a user’s file. Follow the links for more information.

4. Select the environmental and contextual layers to be sampled at species locations
Environmental data will return a numeric value, for example a value of the mean annual temperature at each of the point locations. Sampling contextual layers will return a category/class, for example, a land-use category such as ‘Forestry’ or a State / Territory such as ‘Victoria’.
The download data file also contains TRUE/FALSE values for a range of data quality checks processed by the Atlas, or issues raised by users (e.g., ‘Suspected outlier’). Each column will only appear, if at least one record has a value of TRUE. See the Google Spreadsheet below for more details.
There are several ways to easily select multiple layers, or to reuse a layer set from a previous session. A pre-set best 5 terrestrial layer set is also available. See Selection of multiple layers for more information on using this feature.
Note: Clicking on the  icon (to the right hand side of the name column) when selecting environmental or contextual layers to sample, shows the metadata describing the layer.

Metadata for the layer Precipitation - seasonality (Bio15)
Press the Next button to access the Download dialogue window.

Fill in the fields and then press the Next button.
Following the selection of the layers, a zip file is produced containing the occurrence records as a data.csv file, and the citation details of each of the data providers as citation.csv. You will be sent an email with a link to the DOI for the file. From here you can download the file.

Example files contained in the data.zip:
- All species occurrence records for the Queanbeyan LGA: data.csv file (3 MB)
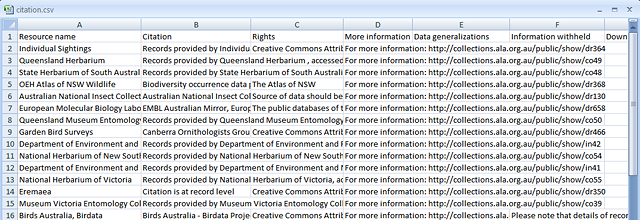
- Citation for data providers providing the data.csv: citation.csv file (16 KB)
NOTE: Data files can be potentially very large so they are zipped for efficient downloading. The citation file is included to ensure data providers are acknowledged accurately. You will need an application that can unpack zip files.
The Google Docs Spreadsheet contains the fields given in the data.csv occurrence download file. The fields are based mainly on Darwin Core terms. Not all fields have a Darwin Core equivalent.
NOTE: When dealing with ‘sensitive species’, the records may flagged and/or altered. The following can occur
- The records supplied to the Atlas of Living Australia have already been modified because of the sensitive status of the species. For example, the coordinates may be truncated to one or two decimal places. Hopefully, this modification should be apparent.
- The records have been modified by the Atlas of Living Australia in accordance with rules established by the relevant States and Territories. When this occurs, the download fields “Information witheld during processing” and/or “Location generalized during processing” will contain information to suggest changes have been made.
- If common names exist for a species, only the ‘preferred common name’ is listed. For fish species, this will be a recommended common name proposed by the community. For non-fish species, the preferred common name will be the one most preferred by users of the Atlas. In this case, the preferred common name for a species may change over time.
It is therefore important to carefully view the downloaded records and the associated README.HTML file to ensure that you are aware of information that may affect any subsequent analysis of the data. For example, while Prediction will not run on sensitive species, downloading the records and uploading them for use in Prediction would be extremely unwise.
Example of a saved data.csv file
Example of a saved citation.csv file
Analyses Using the Samples File
The data.csv file can be used in a wide range of analysis packages. For example, the ‘R’ language and environment for statistical computing and graphics.
‘R’ compiles and runs on a wide variety of UNIX platforms, Windows and MacOS. For more information see (http://www.r-project.org/).
Instructions for ‘R’ loading
The data.csv file downloaded from the spatial portal can be used directly in the command line in ‘R’. It takes only two lines of ‘R’ script, or four, if comments are included (as shown below). Paste them into the ‘R’ console. Remember to change the path to reflect where your data.csv file is kept.
Sample ascii text file for loading data.csv into ‘R’ – r_samples_load.txt (1 KB)
##### Reads the results of a download from the ALA spatial portal into
##### R dataframe 'data.csv' from default path, currently C:/Data/R
samples<-data.frame()
samples<-read.table("C:/Data/R/data.csv", sep=",", header = T)
| Information withheld during processing |

